Using GraphQL to Build My Own Cloudflare Analytics Page
CloudFlare has a nifty GraphQL API that lets you fetch analytics data older than the default 30 day window it shows in the dashboard. In this post I show you how to set it up, and fetch total requests and unique views.
I’ve recently started a side project which has gotten more popular than I expected (~100k users). It’s also part of the reason I haven’t posted since January. While I won’t reveal what it is just yet, it did allow me to experiment with the Jamstack (which I’m really liking). The “JAM” in Jamstack stands for JavaScript, APIs and Markdown. It’s a way to architect an application so that it can be decoupled from a central server, pre-rendered and therefore hosted anywhere as a static site. With Jamstack, the entire front end is prebuilt into static pages and assets during a build process. The big upside to this architecture is that sites can be served directly from a CDN, without a backend server…at all!
Enter Cloudflare
As a primarily AWS user, I decided to try something different and use Cloudflare, having heard great things. The onboarding process was very easy, mainly centered around changing Name Servers. Once that was setup (and the obligatory 48 hour “DNS-related-lag-that-makes-you-doubt-your-config” lag passed), I was up and running with Cloudflare. I setup a simple page rule to cache everything and I was on my merry way.
Cloudflare Dashboard Analytics
Now one great thing about Cloudflare, is that it gives you very simple analytics right from the dashboard (requests, views, cached data served, uncached data served, etc). This was great for the first couple months as I used it as a simple way to monitor traffic. Here’s what it looks like:

Upon clicking on “View more analytics” Cloudflare gives you access to more fine-grained data, but I quickly realized after the first month after launch that I couldn’t extend the analytics window past 30 days, so I needed a way to query that data myself.
So I was only interested in two things:
- Total Requests (aggregate & daily)
- Views (aggregate & daily)
Cloudflare Analytics GraphQL API
At first, I thought I needed some paid subscription or enterprise support of some sort. But I knew Cloudflare was a dev-friendly company so I kept digging. Eventually I found out they have a GraphQL endpoint dedicated to querying Analytics data.
So I whipped out GraphiQL and followed their brilliant guide
Authentication
Authenticating is quite easy, all I needed to do was add two HTTP headers in the API requests, one of which was the X-AUTH-EMAIL header, with value set to your email. The other was the specially generated bearer Authorization token (or alternatively I also tried using my global API key via the X-AUTH-KEY header).

Querying for Views and Requests
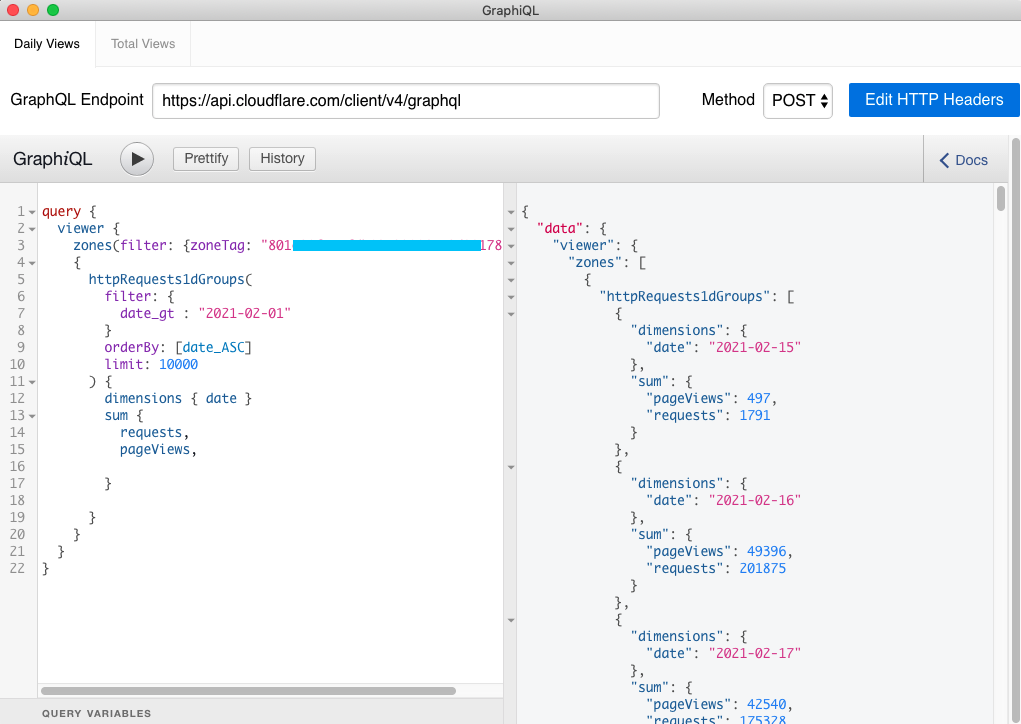
Once the headers were setup, I pointed GraphiQL to https://api.cloudflare.com/client/v4/graphql and tried a couple of their example queries to test authentication. Success! However none of their examples had the fields I was interested in: requests and views. So after a little look at their schema I wrote the following two queries below using the httpRequests1dGroups data set and querying for requests and pageViews. The first query gives me a daily breakdown of views and requests, and the second gives a total aggregate.
GraphiQL is really easy to setup and use. Here’s what it looks like once you setup your headers, and write your first query (yes, that’s my real data!). If you’re wondering what happened on the 16th of Feb, well the Reddit Hug-of-Life™ happened.
Daily Views & Requests
query {
  viewer {
    zones(filter: {zoneTag: "801c28fc7...d90178b2" })
  	{
      httpRequests1dGroups(
        filter: {
          date_gt : "2021-02-01"
        }
        orderBy: [date_ASC]
        limit: 10000
      ) {
        dimensions { date }
        sum {
          requests,
          pageViews,
        }
      }
    }
  }
}
Which outputs:
{
  "data": {
    "viewer": {
      "zones": [
        {
          "httpRequests1dGroups": [
            {
              "dimensions": {
                "date": "2021-02-16"
              },
              "sum": {
                "pageViews": 49396,
                "requests": 201875
              }
            },
            {
              "dimensions": {
                "date": "2021-02-17"
              },
              "sum": {
                "pageViews": 42540,
                "requests": 175328
              }
            },
            // ...
          ]
        }
      ]
    }
  },
  "errors": null
}
Aggregated Views & Requests
query {
  viewer {
    zones(filter: {zoneTag: "801c28fc7...d90178b2" })
  	{
      httpRequests1dGroups(
        filter: {
          date_gt : "2021-02-01"
        }
        limit: 10000
      ) {
        sum {
          requests,
          pageViews
        }
      }
    }
  }
}
Which outputs:
{
  "data": {
    "viewer": {
      "zones": [
        {
          "httpRequests1dGroups": [
            {
              "sum": {
                "pageViews": 356899,
                "requests": 1329471
              }
            }
          ]
        }
      ]
    }
  },
  "errors": null
}
As you can see, both queries are almost identical except the second doesn’t have a date dimension and corresponding orderBy logic.
Conclusions
What’s great about this setup is I have full control of what analytics data I see, and I can integrate both the query (via a simple fetch) as well as the output into a visual web dashboard and have a realtime view of how my website is doing.
For example:
function fetchAPI(url, email, apiKey, zoneTag) {
    let request = new Request(url)
    let query = {"query":"...the stringified query here...", "variables":{}}

    let init = {
        method: 'POST',
        body: JSON.stringify(query)
    }
    request.headers.set('x-auth-key', apiKey)
    request.headers.set('x-auth-email', email)

    return fetch(request, init)
}

// More info if interested:
// https://developers.cloudflare.com/analytics/graphql-api/tutorials/build-your-own-analytics
If you’re using Cloudflare, give it a go, and let me know if you build something cool!